
Developing story.
The third major storm in two weeks blasted a wide swath of beleaguered New England with more than 2 feet of snow Monday, again smashing records and paralyzing travel in hard-hit Boston.
After setting a seven-day snow record last week, Boston had 22 inches of fresh snow, and the storm was forecast to last into Tuesday in some areas. Massachusetts Gov. Charlie Baker declared a state of emergency, clearing the way for him to request snow-removal help from neighboring states.
“It’s otherworldly,” said Shmuel Bollen, 50, of Natick. “Shoveling the driveway becomes like painting a bridge. As soon as you get to the end, you have to go back and start again.”
Above, video from Minnesota Public Radio gives clear visualization of how a warmer atmosphere holds more water.
Those of us that remember 5th grade science know why this is. Nevertheless, there is the continued need to explain that, when a puff of cold air comes down from the arctic, that added moisture is going to turn to snow.
Remember last week, when you may have heard that warnings of a giant east coast blizzard were exaggerated? Since then, Boston has been buried under waves of snow in a record onslaught – almost 62” in a little over 2 weeks, and counting. We are witnessing a classic extreme event of exactly the type, in exactly the location, that climate models have been telling us to expect.
Nearly any way you cut it, Boston has just ended a record-setting stretch of snow, with 90 percent of this season’s total snowfall having fallen in the past 10 days alone. And there’s still at least another month of winter left.
Since Jan. 24, Boston has logged 47.9 inches of snow. Last Tuesday’s “Blizzard of 2015″ brought an incredible 22.1 inches in one day. After a few more inches fell throughout the next week, Monday’s Groundhog Day storm dropped an additional 16.2 inches on the city, bringing the 7-day total to 40.5 inches.
The back-to-back blizzards broke multiple records for snowiest periods in Boston. Monday, Feb. 2, ended the snowiest 5, 7 and 10-day periods for the location since records began there in 1891. As WBZ’s Eric Fisher said on Monday night, Boston “obliterated and buried” the previous 7-day snowfall record by over nine inches.
Climate scientist Mike Mann tweeted monday night about higher than average sea surface temperatures (SST) off the northeast US coast – contributing to as much as a doubling of moisture in the local atmosphere.

In an email, a senior meteorologist tells me “..I’ve never seen a SST anomaly of +11.5C, but that’s the case just east of Cape Cod. No wonder Boston is submerged. Almost 62” in a little over 2 weeks, and counting. Quite amazing, really.”

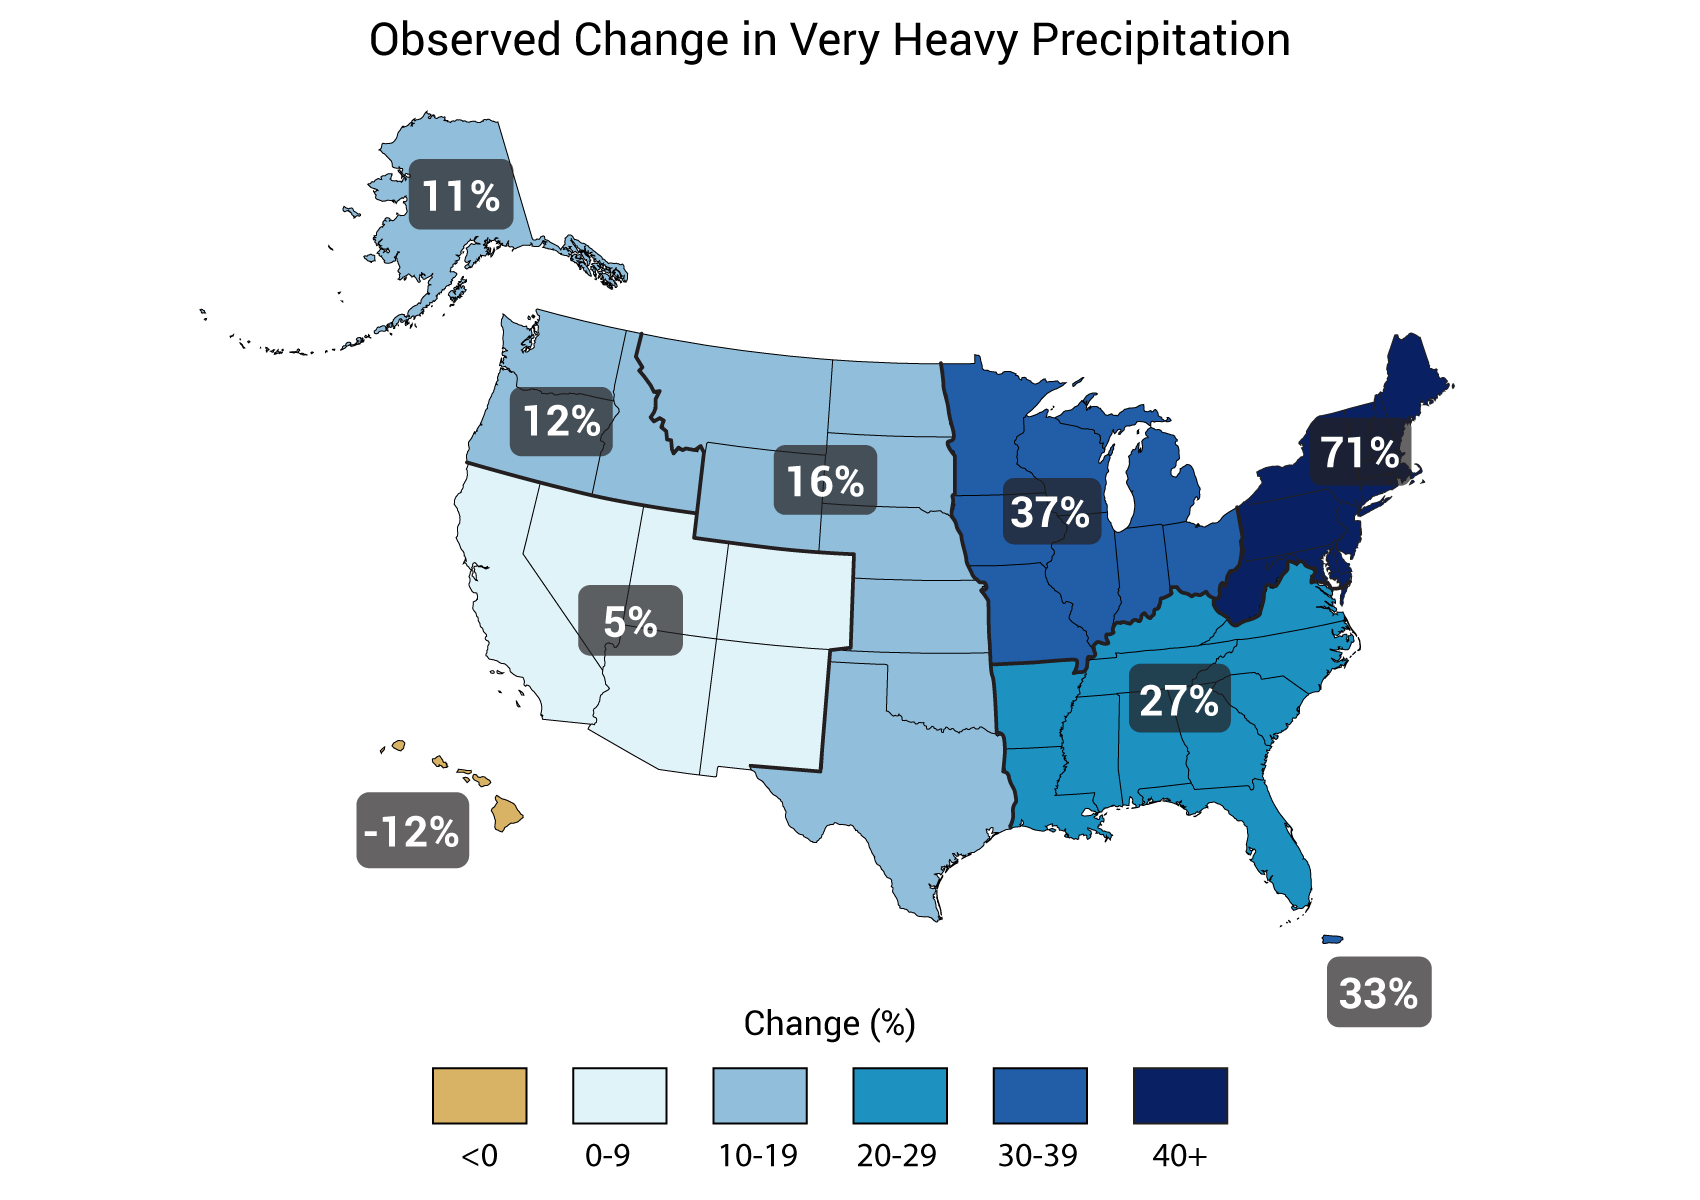
Extraordinary conditions produce extraordinary weather events. Increased precipitation is a slam dunk prediction in a warming world, something that we observe in the Northeast more than anywhere else in the US.

Part of the human dimension is that systems and infrastructure that were conceived and built under a different atmospheric regime are now buckling when extremes go beyond what their builders could imagine.

Heavy snow accumulations that have impacted the area for weeks is leading to roof collapses, and officials are warning property owners to remove snow from roofs if it’s safe to do so.
More fun facts from Climate Nexus:
Snowstorms are an expected feature of winter weather in the Northeast, but the recent spate of storms in the region exhibits the fingerprints of climate change in several distinct ways. Above average sea surface temperatures add energy to the system, creating a stronger contrast with the cold front. That temperature gradient powers the storm, so a stronger gradient means a stronger storm. Also, warmer air holds more moisture, resulting in more precipitation.
- Blizzards like this are costly. One estimate suggests that it costs Boston $300,000 for every inch of fallen snow, while a one-day storm costs Massachusetts about $265 million and New York $700 million. This means the total cost of January’s storm could exceed $1 billion, with canceled flights alone costing the economy $230 million. Boston’s public transit paid $2.1 million in overtime to restore service after the last storm. January’s snow also hit local city budgets hard. For example, early estimates for snow and ice removal in Lawrence, Massachusetts, are over $1 million, far in excess of a budgeted $150,000. Similarly, the city of Marshfield, Massachusetts, expects to “blow through” its $400,000 snow budget as a result of January’s snow.
- The US National Climate Assessment shows that there has already been an increase in extreme precipitation in the Northeast, with precipitation rising by 71% between 1958 to 2012. The UN Intergovernmental Panel on Climate Change’s (IPCC) global and regionalprojections indicate that precipitation in the Northeast will continue to increase. The IPCC explains how there will be “significant increases in either the frequency or intensity of heavy precipitation over the 20th century.” Its models show that the largest changes are expected to occur over Eurasia and North America, particularly during the winter. The increase in atmospheric moisture content explains most of the projected increase. A new study finds that an, “Increase of extreme precipitation has occurred in all regions of the continental USA and further changes are expected in the coming decades.”
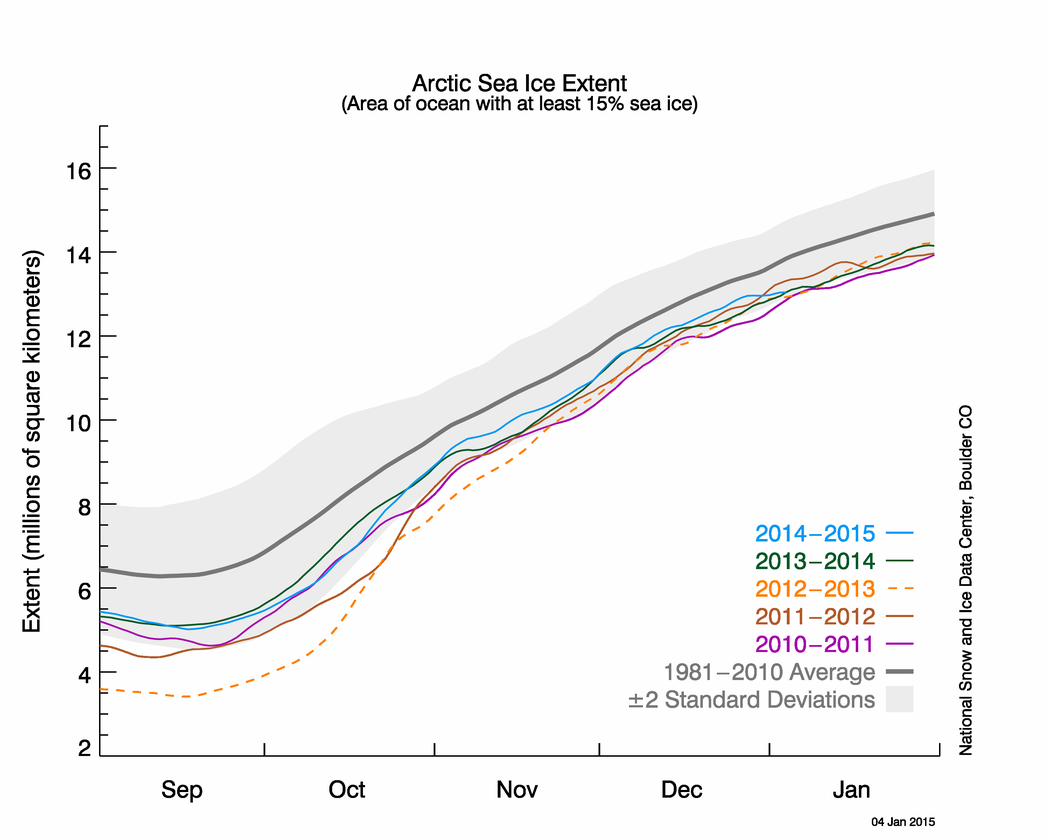
- Arctic amplification, driven by several factors related to global warming including the loss of Arctic sea ice, may have loaded the dice in favor of snowier conditions in large parts of northern mid-latitudes by changing atmospheric circulation patterns. Changes in atmospheric circulation may be weakening the jet stream, making for a more wavy pattern, which in turn brings down air from the Arctic. Currently the jet stream has weakened and dropped further south than normal, in line with this hypothesis. In addition, loss of arctic sea ice may be yet another factor driving more precipitation into winter storms as exposed arctic seas offer up moisture to passing weather systems.
More than two feet of snow was recorded in Quincy, Cohasset and Weymouth, Mass., the National Weather Service reported.
Monday’s snow depth in Boston was 37 inches, which was the city’s largest depth ever recorded since weather records began.
The National Weather Service’s Boston office said on Twitter that the city has received 76.5 inches of snow so far this winter. But nearby Providence, R.I., got just 4.2 inches of snow from this storm, the weather service reported.
Boston set a record for the most snow recorded in a 30-day period, with 71.8 inches, breaking the record of 58.8 inches set in February 1978.
Climate change is great for the snowblower business, creates jobs, brings people closer together!
Believers need to show us the way to salvation by turning off their heat right now. We must shun all modern technology as evil and denounce anyone who says anything else, especially satellites that constantly lie.
I hear the new church of the CO2 is opening in your neighborhood. Now is the time for all good people to come to the aid of the planet. You must sacrifice your children to the CO2 god.
It never snowed in the past when it was colder.
We must now ban also dihydrogen monoxide as it is 95% of greenhouse gas!
sorry, its the climate deniers who are wedded to 19th century technology, and medieval science denial.
19th century technology like whale oil and chopping your own wood? Yes, deniers long for those days!
no, 19th century like burning coal and oil. didn’t think I’d have to explain it. guess you’re new here.
What 21st technology will replace 1700 Kw-hours in a barrel of petroleum? Assuming you are against new forms of nuclear?
Did they have deep water, fracking, or shale in the 19th century, and an energy grid? We should of course scrap all of these and fly around in solar powered Jetson cars!
I’m curious exactly what forms of energy are acceptable to the CO2 alarmist? I love strawbale homes, they are simply beautiful. Too bad I can’t afford to build one myself.
You are welcome to join the conversation. But you need to acquaint yourself with the facts. no need to wait 25 years for “new forms of nuclear”.
http://climatecrocks.com/2015/01/28/big-energys-kodak-moment-phase-change-as-solar-cheaper-than-gas-in-dubai/
http://climatecrocks.com/2014/11/29/the-weekend-wonk-with-coal-on-the-ropes-is-this-the-beginning-of-the-end-of-oil/
You believe solar panels will replace the energy to run the United States? Can solar heat millions of homes?
If 1 barrel of oil = 1700 KW hours, it would take around 140 100W solar panels running for a month (5 hrs sunlight daily) to equate one barrel. It would take a person riding their bicycle for 8 years 40 hours per week.
USA uses 20 million barrels oil per day, not to mention the nuclear energy and coal. How many solar panels will that take? 20M x 140 x 30 (days) = 84 billion solar panels just for oil. You must double that number to get reliable, so now it’s 168 billion panels. Solar is unreliable and only works during the day, if it’s not cloudy.
Solar is great for individual, local and small applications and for self-sufficiency. I run a 12V fridge/freezer on a 30W trickle panel for camping.
There are safer forms of nuclear and plasma electric generation in the works. 1/100th of a millionth of a gram of hydrogen can produce 1 kW hour. E = mC^2. You are correct, we can get past the combustion era.
We can also get past the fear mongering about CO2 and live in the real world. CO2 is not a pollutant, it is the gas of life. What’s the ideal level
of CO2? 350ppm cuz Bill McKibben says so? Plants grow their best at around 1000ppm, ask growers. You exhale 40,000ppm per breath. The sun drives the climate on Earth not a .04% gas of life.
“There are safer forms of nuclear and plasma electric generation in the works.”
Ok. Let’s race.
1000ppm might be nice in a controlled environment like a contained greenhouse where you have plenty of water you can add whenever you need it. But for a planet its really really bad news, and especially so if risen to 1000ppm within a few hundred years. No living thing on this planet will be able to adapt fast enough to the changes in climate, including humans.
Classes must have let out early at the local high school (perhaps because of snow?). This sloppy mish-mosh of cliches sounds like it was written by a moderately clever sophomore (from the Latin “sophos” (wise) and “moros” (foolish)—ergo, a “wise fool”. Go play with your gameboy, Junior.
Xbox.
You may return to your worship service now. The CO2 Priests are missing their choir-boy.
Interesting that higher base temperatures of increase of about 1 degree C increases severe snowstorms. I am now sure that the dinosaurs living in even a hotter tropical climate than now, must have also enjoyed the ultra severe snowstorms.
Also amusing that almost all scientific claims of climate change are much devoid of verifiable numbers – like what is the percentage contribution by mankind. If you do start comparing numbers from various reputable sources, the numbers as so divergent to dispute themselves.
Actually the IPCC has a pretty detailed graph of the various atmospheric forcings, which I found in two clicks.
http://www.realclimate.org/images/ar4_fig_spm_2.png
As far as comparing numbers, all of the major reputable sources, the half dozen or so major temp records worldwide, are in broad agreement.
http://www.carbonbrief.org/media/375180/tempdatasets2-5.png
The currency of this blog is fact.
To get any respect here, you’d have to produce links to specific examples of your claims. Hope this helps.
So do we believe the scientists who proclaim the ‘end of wintertime and wintertime activities as we once knew them’ due to a forecast lack of snow… or the new prognosticators who claim we will see much MORE snow with the advent of global warming? The great thing for them…. is they are right no matter what!
We apparently label that as science!
Actually, what we are observing is snow,(and rain) in areas like Boston increasingly coming in large events, which is much in line with expectations. Globally, the biggest declines in snowcover are not seen during december – february, but more in the spring, as less snow is persisting into april, may, june across the northern hemisphere.
More on this in a coming post.
Any idea where the +11C anomaly was spotted? The data I’ve seen gives between +4 and +6 off the Eastern seaboard (i.e. your earth link, and your post today “Mike Mann on the Meaning of Boston’s Snowmageddon”)
Cheers!
That’s. Just plain stupid! If yoh lived here you would see it is a dry powder no moisture to even make a snowball. Buildings are collapsing because in less then 2 weeks we have recieved almost 6 ft of snow.. Then you have the warming sun melting and freezing creating ice which is much heavier.
I’ve only managed to find same day image loops so far. If anybody knows where to find those for the past three weeks and/or classical weather maps…
In the meanwhile, I have found this post about the Blizzard of 1983 that was definitely worsened if not caused by relatively warmer and moisture-carrying air from the Atlantic – although I do no think this applies to 2015
http://www.washingtonpost.com/blogs/capital-weather-gang/post/the-megalopolitan-blizzard-of-february-10-12-1983/2013/02/12/be05ae32-73a9-11e2-aa12-e6cf1d31106b_blog.html
Facts do not seem to be welcome on Peter’s site.
“Winter of 1886-87 stands as coldest” January 31, 2009 6:00 pm • JENNY MICHAEL Bismarck Tribune
“Bismarck’s snowiest winter occurred 11 years ago, but the city’s coldest winter goes back farther – to the days when Dakota was a territory. Half of Bismarck’s 10 coldest winters were prior to 1900, and none was colder than the winter of 1886-87. From December to February, the average temperature was 0.4 degrees below zero – Bismarck’s only winter with a below-zero average temperature. The season devastated livestock and ranchers in the west. Cattle, overstocked by ranchers during the summer’s drought, died by the tens of thousands as hard snow hid the sparse prairie grasses. Storms raged from November to February. Five minimum temperature records from January 1887 still stand in Bismarck, including 41 below on Jan. 1 and 44 below on Jan. 2.”
http://bismarcktribune.com/news/local/winter-of—stands-as-coldest/article_e31e9065-975c-551a-b3b1-e967e9231dc9.html
I do not see why your piece of information refutes anything within climate science or indeed Peter’s blog here. Yes it has been both colder and warmer in earths past. What you need to ask is, did those weather incidents occur naturally or was is induced by a human change in climate. This is a vital part of why this site exists, the point being to understand that the current and rapid change in climate is caused by human interference and not based on e.g. the Milankovich cycles or other natural factors.
Also when you discuss changes in climate you also have to think about the time span i which those changes occured, and what effect they did have on the current species living at the time. One also have to appreciate that human beings started cultivating the soil only 10000 years ago. Our current civilization is highly built upon the stable climate we have had this interglacial (which in fact has been exceptionally stable too until we started pouring tons of CO2 into the atmosphere).
“Facts do not seem to be welcome on Peter’s site”. That said by the flaming anal orifice who is infamous for using only those facts that suit his deluded worldview and totally rejecting all others. Hypocrisy, anyone?
Welcome back, Stonehead! Apparently, once-banished fools are welcome on Peter’s site. Did you ask to be reinstated, or did Peter only banish you for a specified number of months and you’ve served your time?
At any rate, it is nice to see you back looking through the wrong end of the telescope again. It’s also nice that you have given up harping on the temperature records from that boring flyspeck in the center of England and moved to North Dakota.
As expected, your laser sharp mind has gone back 140 years to cherry-pick data you seem to think means something rather than concentrate on the more important time span of the last 50 years (and the last 15) Did you know that the highest and lowest temperatures ever recorded in ND occurred the SAME year—-1936? Can you explain that?
So, what explains the record cold in the Boston area? Global warming?
Could be, although the deniers will say “the science isn’t settled and it’s the sun and CO2 is good for you and Al Gore and….”
The record cold in the “Boston area” could just be natural variability—remember that weather is local and it has been cold in Boston before.
But if you look at the record cold, heat, drought, flood, wildfires, ice melt, extreme weather, etc. that is occurring all over the globe AND which correlate with AGW AND have been predicted by the models, what other conclusion can you reach?
You are falling into the “Ah looked out mah winder, an’ it wuz cold, so there ain’t no globull warmin” fallacy.
Explained here in relation to last year’s arctic blast