
National Weather Service September 12:
AREA FORECAST DISCUSSION
NATIONAL WEATHER SERVICE DENVER/BOULDER CO
941 AM MDT THU SEP 12 2013

.UPDATE...MAJOR FLOODING/FLASH FLOODING EVENT UNDERWAY AT THIS
TIME WITH BIBLICAL RAINFALL AMOUNTS REPORTED IN MANY AREAS IN/NEAR
THE FOOTHILLS. PRECIPITABLE WATER VALUES IN EXCESS OF AN INCH AND
A QUARTER ON GPS SENSORS CERTAINLY SUPPORT LOTS MORE RAIN TODAY
AND TONIGHT.  13Z HRRR RUN HAS ANOTHER 1-3 INCHES OF RAIN
PREDICTED IN THE FOOTHILLS THROUGH 04Z SO THINGS ARE NOT LOOKING
GOOD. WILL EXTEND THE AREA OF THE FLASH FLOOD WATCH TO INCLUDE
ZONE 43 AND ALSO EXTEND IT IN TIME THROUGH 12Z TOMORROW MORNING.

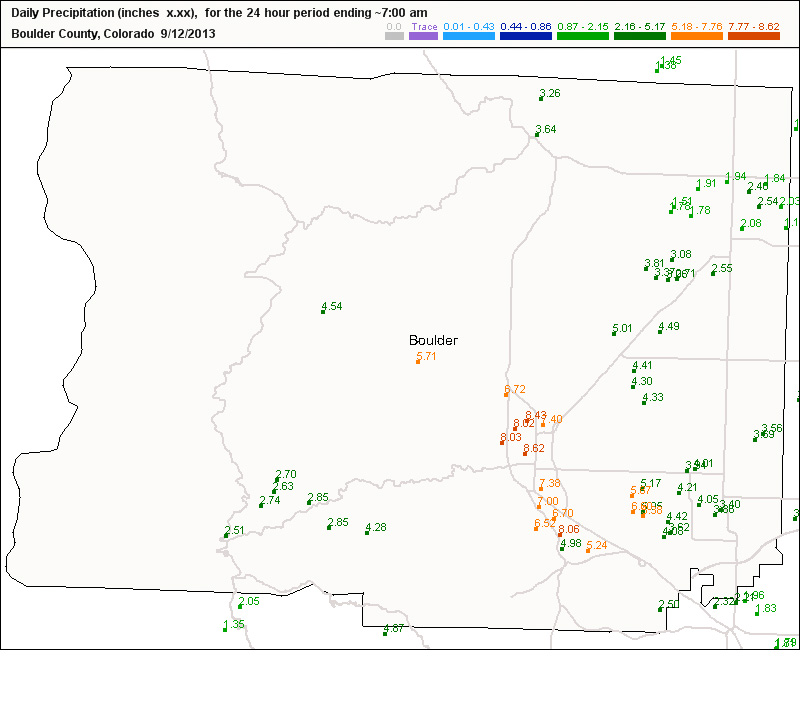
As of Friday morning, 12.30 inches of rain had fallen in Boulder, Colo. since Monday afternoon.
According to the Western Regional Climate Center, the previous all-time record rainfall for any calendar day in Boulder was a 4.80 inch deluge on July 31, 1919., in records dating to 1893.
Furthermore, the previous wettest September day was only 3.05 inches on Sep. 4, 1909. In fact, only two other September days featured over two inches of rain, none previously since 1938.
The ten previous wettest calendar days in Boulder since 1893 all occurred between early April and early August, according to National Weather Service.
Average September rainfall in Boulder is only 1.63 inches. So, Boulder picked up over seven times their average September monthly rainfall…in just over three days! The previous wettest single month in Boulder produced only 5.50 inches of rain.
Early Thursday afternoon, a storm total of 11.5 inches came in from Aurora, Colo., an eastern Denver suburb.
Dr. Jeff Masters tells me in an email that these conditions are definitely “Not normal.” He goes on –
“Balloon soundings from Denver last night and this morning recorded the highest levels of September moisture on record for the station. The total precipitable water (PW), which is how much water would fall at the ground if the entire amount of water vapor through the depth of the atmosphere was condensed, was 1.33″ at 12Z (8 am EDT) on September 12, and 1.31″ at 00Z September 12. The previous September record was 1.23″, set on September 10, 1980. Balloon soundings began in 1948. The flow pattern resembles the one that brought Canada’s most expensive flood of all-time to Calgary earlier this summer, with an upper-level low trapped to the south of an unusually strong ridge of high pressure.
Probably as good a time as any to review my video with Jeff Masters and Jennifer Francis discussing the mechanism by which weather gets “stuck” – changes in the jetstream that appear to be related to climate change.
UPDATE:

click to enlarge
Some context: We went from breaking record high temperatures last week (including tying the record — twice — for the highest temperature ever recorded in September in the Denver area), to what appears to be unprecedented torrential rainfall that has caused devastating flash flooding and killed at least two people in this area, and another person further south.
Some numbers to consider: Over the past 18 hours or so, Boulder has received 9 inches of rain. By comparison, average total precipitation for Boulder for the entire month of September is just 1.68 inches. And the record tally for the entire month was 4.67 inches, according to a weather forecaster on Channel 7 here.
The proximate cause is tropical, monsoonal moisture streaming up from the south and a stalled front that is pinning it all right over us.
What ? I have been programming since 1969 on ICL, IBM, Honeywell, Univac, and much more in Fortran and Assembler and using every damn discipline dreamed up , and I pissed off you doubt this all I was saying that climate modelling is in dispute but in every other fields it is trusted, you have made me exceedingly angry by doubting my past, stuff you !!!! In 1981 I was a veteran
Robert – if you write “never heard any criticism of computers or programming in my programming career” I can only respond to that. That sentence is absurd.
Every programmer obviously knows there is a lot of programs that should be rewritten from scratch, and “criticism of computers or programming” has been going on since Turing’s times.
Incidentally, Suzanne R. Dodd, the Voyager project manager, recently told the New York Times:
“These younger engineers can write a lot of sloppy code, and it doesn’t matter, but here, with very limited capacity, you have to be extremely precise and have a real strategy,” she said.
If you want to discuss the use of computer modelling in various fields, I have the impression it would be fairly off-topic for this blog post.
We are getting right off the point which was that computer programs (based on science) have predicted more floods and precipitation in certain areas and that appears to becoming true. The EPA site has a good discussion on computer modelling for one. You are starting a whole new discussion (this is an annoying trait of trolls and dare I say deniers) , I can see nothing absurd about my statement, except for the poor English which was due to a combination of a bad temper and beer. I honestly never saw a program that needed rewriting or sloppy code in my entire career. We were subject to third party and group checking and rigorous test plans and testing. I spent a lot of time working in countries that English was not the first language (so I may have missed an odd criticism spoken in a foreign language). I have retired now so I do not know about today’s programming standards but modelling programs were mature way back in the 1970’s, including atmospheric models for science. You a programmer are pasting alleged quotes about your own profession from a project manager, have you no pride ?, what sort of project manager would allow sloppy programming and say it does not matter, I suggest they replace her with one who would do something about it. My whole point was modelling programs have predicted what is happening now so do not be surprised that they actually are working.
Ok Robert that clarifies it. Am not sure with you guys though, I provide a direct reference to an IPCC document about climate extremes but still, nobody can admit the truth of it, and we get bombarded by still-baseless claims.
We shall wait for AR5 and see where the science of climate extreme stands. I have read in another post here, it’s in its infancy. Good luck with trusting your life on an infant. 🙂
No, let’s trust a risk-averse, middle-aged, white male who will sacrifice everything for his grandiose free-market ideology. 😀
Not living in Boulder, eh?
NevenA -you’re a despicable free market obsessive -and I’m not “white”
http://www.ipcc-wg2.gov/SREX/images/uploads/SREX-All_FINAL.pdf
http://omnologos.com/official-ipcc-words-we-do-not-know-if-the-climate-is-becoming-more-extreme/
You should try reading the report not just use a Q&A to make it what you like it to be. It said:
“One approach for evaluating whether the climate is becoming more extreme would be to determine whether there have been changes in the typical range of variation of specific climate variables.” (from the Q&A 3.1)
At the moment we are talking about precipitation extremes: so let’s look at the same IPCC report but on page 145. Let also look at the particular region and for the period of the last century.
“ The largest trends toward increased annual total precipitation, number of rainy days, and intense precipitation (e.g., fraction derived from events in excess of the 90th percentile value) were focused on the Great Plains/northwestern Midwest (Pryor et al., 2009)..”
But, you say we have no way of knowing, but yet it says it is! You should drink from the fountain knowledge not Gargle in it.
So we know that precipitation extremes have increase in this region. We may not have data to quantify every location and or climate variables (missing data), but we can say that it is here. Full quote below :
“Recent studies on past and current changes in precipitation extremes in North America, some of which are included in the recent assessment of the CCSP report (Kunkel et al., 2008), have reported an increasing trend over the last half century. Based on station data from Canada, the United States, and Mexico, Peterson et al. (2008a) reported that heavy precipitation has been increasing over 1950-2004, as well as the average amount of precipitation falling on days with precipitation. For the contiguous United States, DeGaetano (2009) showed a 20% reduction in the return period for extreme precipitation of different return levels over 1950-2007; Gleason et al. (2008) reported an increasing trend in the area experiencing a much above-normal proportion of heavy daily precipitation from 1950 to 2006; and Pryor et al. (2009) provided evidence of increases in the intensity of events above the 95th percentile during the 20th century, with a larger magnitude of the increase at the end of the century. The largest trends toward increased annual total precipitation, number of rainy days, and intense precipitation (e.g., fraction derived from events in excess of the 90th percentile value) were focused on the Great Plains/northwestern Midwest (Pryor et al., 2009). In the core of the North American monsoon region in northwest Mexico, statistically significant positive trends were found in daily precipitation intensity and seasonal contribution of daily precipitation greater than its 95th percentile in the mountain sites for the period 1961-1998. However, no statistically significant changes were found in coastal stations (Cavazos et al., 2008). Overall, the evidence indicates a likely increase in observed heavy precipitation in many regions in North America, despite statistically non-significant trends and some decreases in some subregions (Table 3-2). This general increase in heavy precipitation accompanies a general increase in total precipitation in most areas of the country.”
Stop galloping. FAQ 3.1.
You stated that they were making baseless claims by referencing a cherry pick statement in the IPCC report to support your claim. Your claim of no way of knowing if extreme weather events such as (this) extreme precipitation events has or is occurring(change in trend).
From the same report you cherry packed, I pointed out not only that you can measure that, but we are actually seeing statistical significant trends in various locations on extreme precipitation events and the references for the scientific reports.
In other words their claim are valid and as usual yours are not.
In order to refute this, you need somehow to invalidate the scientific claims in the report which of course you cannot.
But instead you are running down the rabbit hole again and just claim.
“galloping”
Accp -of course if you look at a series of variables some will have become more extreme -the first question is if the climate has, and we (ipcc included) don’t have any way to tell.
the second question is what you define as extreme. once again it’s immediate to know that about local temps but one has to wait years for scientific studies to come to any such conclusion for other weather variables
it’s all a matter of science, despite repeated attempts at vastly oversimplifying the topic.
O.K omnologos, I read the New York Times article on NASA leaving the solar system, where you cut the sloppy code – young engineers quote from (it was quite a light hearted statement regarding old technology and young engineers), quite an interesting article, I also read the Lamframboise piece in JC’s site. regards Bob